Medium Terms Fiscal Plan
for Sikkim
2013-2014 to 2015-2016
To be presented before the Sikkim
Legislative Assembly as required under sub section (1) of section 3
of the Sikkim Fiscal Responsibility and Budget Management Act. 2010
(15 of 2010)
Medium Term Fiscal Plan for
Sikkim: 2013-14
1. Introduction – Fiscal
Policy Overview
The State of Sikkim
has made remarkable progress in achieving socio-economic development
in 11th Plan period and aims at broad based and sustainable growth
process during the 12th Plan period. The fiscal policy adopted by the
State Government over the years and as reflected in this year’s
budget, endeavors to provide an enabling environment for economic
development and achievement of social sector commitments.
The Gross State Domestic Product (GSDP) at constant prices recorded a
growth rate of 8.16 per cent in 2011-12. The per capita income of the
state, which was Rs.30727 in 2004-05, has increased substantially to
Rs.136362 in 2011-12 at current prices[1]. The major socio-economic
indicators for the State show commendable improvement. The poverty
ratio has declined to 13.1 per cent as compared to all India average
of 29.8 per cent. While the literacy rate has increased to 82.2 per
cent, the IMR has gone down to 26 per 1000. The economic development
has helped the State Government to pursue its development agenda. The
State has been emerging from the devastating earthquake of 2011 and
the rebuilding and reconstruction activities are still going on.
The Fiscal Responsibility and Budget Management
Act (FRBM) adopted in the fiscal year 2010-11 continues to provide a
benchmark for fiscal management in terms of budget decisions and
achievements of prescribed fiscal targets. The Act requires the State
Government to present a Medium Terms Fiscal Policy (MTFP) to reflect
on fiscal policy choices made by the Government in the ensuing budget
year and the fiscal stance of the Government in two future years
beyond the budget year in a transparent manner. This is the third
MTFP. The FRBM Act was enacted with the objective of managing the
fiscal policy that ensures stability and sustainability. A
sustainable fiscal management improves the credibility of the
Government and ensures provision of required level of physical and
social infrastructure. Adequate social and physical infrastructure
helps providing an enabling environment for investments which would
create employment and incomes for the people of the state.
The fiscal adjustment path for Sikkim recommended by the
Thirteenth Finance Commission (TFC) with targeted fiscal deficit to
ensure sustainable level of debt ends at 2014-15. The MTFP however
includes projections till 2015-16. The last year of the MTFP will
come under the award period of the 14th Finance Commission, which has
already been constituted. The ensuing budget for the year 2013-14 and
MTFP for next two outward years continue to adhere to the
quantitative fiscal targets with regard to deficits and debt level as
enunciated by the TFC. The prudent fiscal management of the State was
recognised by the TFC and it recommended performance incentive grant
for Sikkim along with various state specific grants. While the TFC
grants have been put to use in the specified sectors, there are many
other sectors in which the State requires generous grants from the
Fourteenth Finance Commission. Indeed the State faces considerable
cost disabilities in service provisions and any innovative programme
requires contribution from the Central Government.
The MTFP 2013-14 presents the fiscal policy
stance of the Government and projected fiscal targets in the ensuing
budget year and two outward years. It reviews the macroeconomic and
fiscal performance of Sikkim for the period from 2004-05 to 2013-14.
The assumptions with regard to the revenue augmentation and
expenditure restructuring parameters for the preparation of the MTFP
are arrived at on the basis of the data covering the period from
2004-05 to 2013-14 (BE) and taking into consideration the policy
announcements relating to revenue augmentation measures and
expenditure priorities in various sectors.
The rest of the report is organized as follows.
The Section 2 provides an analysis of the recent macroeconomic
achievements. The fiscal policy overview, tax, expenditure, and
borrowing policies for the ensuing year and the priorities in the
medium term are presented in Section 3. This section follows
the Form F-1 of the Medium Term Fiscal Policy as per the Sikkim FRBM
Act, Rule 3. In Section 4, Medium Term Fiscal Plan containing
the projection of fiscal variables and assumptions underlying the
projections has been given. This follows the Form F 2 of Sikkim FRBM
Act, Rule 3. The concluding remarks are contained in section 5. The
disclosures, following the Medium Term Fiscal Policy as per the
Sikkim FRBM Act Rule 3 and Rule 4, are given in the Section called
Disclosures.
2. Macroeconomic Outlook
The macroeconomic performance and the outlook for the medium term
influence the preparation of MTFP. The State economy is assumed to
provide a base for the revenue and any projection for the future
years has to be related to the growth performance of the State. The
state level fiscal policy assumes key role in the development of
different sectors and macroeconomic performance. While the Sikkimese
economy was evolving as a service sector driven economy, since
2009-10 the relative share of secondary sector has increased mostly
driven by manufacturing, construction and power sectors. The
inter-sectoral composition of GSDP since 2004-05 shows that the
service sector, which accounted for half of the State GSDP till
2008-09, has declined to about 38 per cent in 2011-12. At the same
time the relative share of the secondary sector has grown to about 54
per cent in 2011-12 (Table 1). The share of primary sector has been
declining over the years and the share of mining and quarrying
activities remained very small.
Table 1
Composition of GSDP (Constant
Prices)
(Per cent)
|
|
2004-05
|
2005-06
|
2006-07
|
2007-08
|
2008-09
|
2009-10
|
2010-11
|
2011-12
|
|
Primary, of Which
|
18.71
|
17.74
|
16.76
|
16.18
|
14.56
|
8.74
|
8.32
|
8.04
|
|
Agriculture
|
18.59
|
17.63
|
16.65
|
16.07
|
14.40
|
8.65
|
8.22
|
7.94
|
|
Mining & Quarrying
|
0.12
|
0.11
|
0.11
|
0.11
|
0.15
|
0.10
|
0.10
|
0.10
|
|
Secondary, of which
|
28.72
|
29.25
|
29.54
|
30.18
|
34.94
|
55.03
|
54.67
|
54.16
|
|
Manufacturing
|
3.86
|
3.60
|
3.66
|
3.90
|
3.65
|
28.44
|
26.88
|
25.84
|
|
Construction
|
19.23
|
19.86
|
19.44
|
18.69
|
15.52
|
9.91
|
10.26
|
10.68
|
|
Electricity & Water supply
|
5.62
|
5.78
|
6.44
|
7.59
|
15.76
|
16.69
|
17.54
|
17.64
|
|
Tertiary, of Which
|
52.58
|
53.01
|
53.70
|
53.64
|
50.51
|
36.22
|
37.01
|
37.80
|
|
Transport
|
2.69
|
2.63
|
2.59
|
2.48
|
2.26
|
1.61
|
1.60
|
1.59
|
|
Trade, Hotel and Restaurant
|
5.19
|
4.84
|
4.62
|
4.51
|
4.07
|
2.43
|
2.30
|
2.22
|
|
Banking & Insurance
|
2.58
|
2.95
|
3.59
|
4.04
|
3.64
|
2.60
|
3.12
|
3.74
|
|
Real Estate
|
9.99
|
9.38
|
9.19
|
9.94
|
9.49
|
5.60
|
5.46
|
5.32
|
|
Public Admn
|
14.60
|
15.14
|
15.52
|
14.79
|
14.15
|
11.72
|
11.56
|
11.53
|
|
Other Services
|
16.09
|
16.52
|
16.41
|
15.81
|
14.70
|
10.93
|
11.45
|
11.57
|
|
GSDP Growth Rate
|
|
8.45
|
4.53
|
6.53
|
14.81
|
71.59
|
6.90
|
6.93
|
Source: State Income Unit, DESM&E, Government of Sikkim
.
The impressive growth of GSDP in recent years was due to the
contributions from power and manufacturing sectors. The Planning
Commission (State Plan Division) while analyzing the growth process
of the State during the Eleventh Plan indicated that commissioning of
power projects, strengthening of small scale industries and
pharmaceutical industries helped the growth process. The MTFP
projection, however, is based on the growth path prescribed by the
TFC for Sikkim. TFC has assumed a nominal growth rate of 11.25 per
cent for Sikkim during the period 2012-13 to 2014-15.
3. Fiscal Profile of the State
3.1 Fiscal Policy Overview
The fiscal trend since 2004-05 presented in Table 4
shows that there has been considerable improvement in the fiscal
situation in recent years. The State has been maintaining surplus in
the revenue account and the fiscal deficit has been reduced to the
level prescribed by the TFC. The introduction of FRBM Act in 2010-11
provided the rule based fiscal management with defined deficit and
debt targets. The post FRBM experience indicates considerable
improvement in fiscal situation and containment of fiscal deficit and
rise in revenue surplus. The surplus in the revenue account which was
at 11.7 per cent to GSDP in 2008-09, increased to 12.9 per cent in
2012-13 revised estimates. The budget estimates for 2013-14 assumes a
revenue account surplus of 9.7 per cent to GSDP. The fiscal deficit
was reduced considerably from 7.2 per cent relative to GSDP in
2008-09 to about 2 per cent in 2011-12 and is projected to remain
limited to 3 per cent in the budget estimates for the year 2013-14.
The fiscal consolidation will be instrumental for growth in the
future years by creating fiscal space for the State Government to
allocate resources to the priority areas. The MTFP projects to
maintain the fiscal consolidation process in the two outward years
and improve resource availability to social and economic sectors.
The fiscal trend indicates that the State
Government complied with the TFC recommendations and its own FRBM
targets. The TFC in their fiscal consolidation path for Sikkim has
targeted the fiscal deficit to decline and recommended it to be at
the level of 3.5 per cent to GSDP in 2011-12 and 2012-13 and further
reduce to 3 per cent in 2013-14 and 2014-15. The State FRBM act,
enacted in 2010-11, stipulates to reduce the fiscal deficit to 3 per
cent of GSDP by 2013-14. The MTFP 2013-14 builds on the strong
fiscal performance of the State Government and complies with TFC
proposed path of fiscal consolidation.
Table 2
Fiscal Profile of Sikkim: An Overview
(% to GSDP)
|
|
2004-05
|
2005-06
|
2006-07
|
2007-08
|
2008-09
|
2009-10
|
2010-11
|
2011-12
|
2012-13 (RE)
|
2013-14 (BE)
|
|
Revenues
|
58.1
|
54.6
|
55.7
|
59.8
|
54.4
|
38.2
|
30.1
|
34.2
|
43.5
|
41.0
|
|
Own Revenue
|
13.1
|
13.1
|
16.0
|
16.4
|
15.2
|
10.9
|
7.3
|
6.4
|
7.1
|
7.2
|
|
Own Tax Revenues
|
6.7
|
7.4
|
8.0
|
7.9
|
6.2
|
3.6
|
3.9
|
3.5
|
4.0
|
4.1
|
|
Own Non-Tax Revenues
|
6.4
|
5.7
|
7.9
|
8.5
|
9.1
|
7.3
|
3.4
|
2.9
|
3.2
|
3.1
|
|
Central Transfers
|
45.0
|
41.5
|
39.7
|
43.4
|
39.2
|
27.3
|
22.8
|
27.8
|
36.4
|
33.8
|
|
Tax Devolution
|
6.2
|
9.1
|
10.3
|
13.8
|
11.3
|
6.1
|
7.3
|
7.3
|
7.5
|
8.0
|
|
Grants
|
38.8
|
32.4
|
29.4
|
29.6
|
28.0
|
21.2
|
15.5
|
20.5
|
28.9
|
25.8
|
|
Revenue Expenditure
|
48.4
|
44.7
|
45.1
|
45.8
|
42.8
|
29.8
|
28.2
|
28.9
|
30.6
|
31.2
|
|
Interest Payment
|
5.7
|
5.1
|
5.3
|
4.7
|
4.8
|
2.5
|
2.6
|
2.3
|
2.2
|
2.0
|
|
Pension
|
1.8
|
2.1
|
2.3
|
2.0
|
1.8
|
2.1
|
2.2
|
2.1
|
2.6
|
2.7
|
|
Capital Expenditure
|
20.4
|
17.3
|
15.1
|
16.6
|
18.9
|
11.2
|
6.4
|
7.9
|
16.1
|
12.7
|
|
Capital Outlay
|
20.3
|
17.3
|
15.1
|
16.6
|
18.9
|
10.6
|
6.3
|
7.3
|
16.0
|
12.6
|
|
Net Lending
|
0.1
|
0.0
|
0.0
|
0.0
|
0.0
|
0.6
|
0.1
|
0.6
|
0.0
|
0.1
|
|
Revenue Deficit
|
-9.7
|
-9.9
|
-10.6
|
-14.0
|
-11.7
|
-8.4
|
-2.0
|
-5.3
|
-12.9
|
-9.7
|
|
Fiscal Deficit
|
10.7
|
7.5
|
4.5
|
2.6
|
7.2
|
2.8
|
4.4
|
2.1
|
3.2
|
3.0
|
|
Primary Deficit
|
5.0
|
2.3
|
-0.9
|
-2.1
|
2.5
|
0.2
|
1.8
|
-0.1
|
1.1
|
1.0
|
|
Outstanding Debt
|
61.9
|
60.3
|
61.2
|
62.3
|
59.9
|
37.4
|
34.0
|
30.4
|
29.9
|
29.9
|
Source (Basic Data): Finance Accounts and State
Budget 2013-14
Note: The GSDP figures are from State Income Unit,
DESM&E, Government of Sikkim .
Negative sign indicates revenue surplus
3.2 Revenue Mobilisation
The central transfers that include share in
central taxes and grants constitute the major source of revenue for
the State Government. On an average the central transfers constitutes
little more than there fourths of the total State revenues. The
central transfer, which constituted 39.2 per cent in 2008-09 relative
to GSDP, has come down to 36.4 per cent in the revised estimates of
2012-13 and is budgeted at 33.8 per cent in 2013-14. Own tax and own
non–tax revenue are expected to be 4.1 and 3.1 (net of lottery
expenditure) per cent of GSDP respectively as per the BE of 2013-14.
From Table 2 it is evident that the own revenue and GSDP ratio
has declined substantially since 2008-09. While the growth of state
taxes remained healthy, the ratio with GSDP has declined due to very
high increase in GSDP since 2009-10. The generation of electricity by
newly commissioned power projects and growth of chemical and
pharmaceutical industries have contributed heavily to the growth of
GSDP and the State taxes have not kept pace with the GSDP growth.
A disaggregated analysis of revenue performance of the state is
undertaken to determine the revenue prospects while preparing the
MTFP aligned with the provisions of FRBM act of Sikkim.
Composition of own tax revenue is given in Table
3. The sales tax/VAT and State excise are two major sources of
own tax revenue for the State. The relative share of the VAT was at
42.3 per cent in 2011-12, the last year for which audited figures are
available. It is set to rise to 55 and 53 per cent respectively in
2012-13 (RE) and 2013-14 (BE). The relative share of State
excise in total own revenue has remained at about 25 per cent leaving
the year 2011-12 when its share jumped to 32.8 per cent. During the
same time period the motor vehicle tax has evolved as one of the
major state taxes. The trend growth rates of individual tax
components explain the change in tax structure in the state.
The sales tax, state excise and motor vehicle tax have shown high
growth rates during this period.
Table 3
Composition of Own Tax Revenue
(Per cent)
|
|
2004-05
|
2005-06
|
2006-07
|
2007-08
|
2008-09
|
2009-10
|
2010-11
|
2011-12
|
2012-13 (RE)
|
2013-14 (BE)
|
Growth (04-05 to 13-14)
|
|
Own Tax Revenues
|
100
|
100
|
100
|
100
|
100
|
100
|
100
|
100
|
100
|
100
|
14.2
|
|
Sales Tax
|
41.2
|
38.5
|
43.1
|
41.1
|
50.8
|
54.1
|
51.1
|
42.3
|
55.1
|
52.9
|
18.0
|
|
State Excise Duties
|
28.0
|
22.4
|
19.2
|
19.2
|
23.3
|
25.6
|
25.3
|
32.8
|
25.7
|
25.6
|
16.8
|
|
Motor Vehicle Tax
|
2.8
|
2.9
|
3.4
|
3.1
|
3.5
|
3.5
|
3.8
|
5.6
|
4.1
|
3.9
|
20.3
|
|
Stamp Duty and Registration Fees
|
1.2
|
1.5
|
1.5
|
2.2
|
2.2
|
2.0
|
2.0
|
2.8
|
2.0
|
1.9
|
20.3
|
|
Other Taxes
|
2.0
|
2.2
|
5.9
|
10.0
|
12.9
|
14.4
|
17.6
|
16.5
|
13.2
|
15.7
|
43.8
|
The buoyancy coefficients for the State taxes during
the period 2004-05 to 2013-14 given in Table 4 reveal that the growth
of taxes has fallen behind the growth of the GSDP. The buoyancy
coefficient explains the percentage growth in tax revenue in response
to one percentage growth in GSDP. This relationship assumes that the
State GSDP is the proxy for tax base. The pattern of growth in
the State suggests that the sectors growing rapidly and contributing
to growth process have not contributed to tax revenues. Particularly
the generation of electricity by the hydro-electric sector though
contribute to the growth numbers, their effects are yet to be felt in
terms rise in business and trade activities in the State. The growth
process is expected to provide impetus to rise in trade and business
activities and thus higher tax collection in the future years. The
MTFP after calibrating the growth potential of the GSDP and other tax
measures announced in BE 2013-14 makes suitable adjustment in tax
buoyancies for projection of tax revenues in the medium term.
Table 4
Buoyancy of Taxes: 2004-05 to 2012-13
|
Own Tax Revenues
|
0.546
|
|
Sales Tax
|
0.687
|
|
State Excise Duties
|
0.672
|
|
Motor Vehicle Tax
|
0.773
|
|
Stamp Duty and Registration Fees
|
0.763
|
|
Other Taxes
|
1.501
|
Source (Basic Data): Finance Accounts and State
Budget 2012-13
The own non-tax revenue remains an important
source of revenue for the State as it constitutes about half of the
own revenue receipts. Income from State lottery, power sector, road
transport, and interest receipts has been the main source of non-tax
revenue (Table 5). The relative share of lottery income (net)
shows volatility in terms of its contribution to the own non-tax
revenue and set to decline from 17.8 per cent in 2011-12 to 12.6 per
cent in 2013-14 (BE). The Government initiatives like broad basing
the lottery operations with the introduction of the on-line
lotteries, and introduction of on-line casino operations with the
passage of Sikkim Casino Games (Control & Tax) Act 2002 are
expected to yield increasing revenue from lottery operations. The
relative share of income from power sector has increased in recent
years showing a peak of 64. 2 per cent in 2009-10 as the newly
commissioned hydro-project units started giving the State share in
the production of electricity. Although the relative share of power
sector has gradually declined from 2009-10 high, it still remains
large at 34.6 per cent in 2013-14 (BE). The hydro power projects
being constructed in the State are expected to make significant
contribution in the coming years also. The Government had
rationalized the power tariff by raising it by 16 % in 2012-13, which
helped in improving the income from this source. The share of road
transport in own non-tax revenue has been growing over the years. The
income from forestry and wild life, though declined in between, seems
to have been recovering in the recent years.
Table 5
Composition of States’ Own Non-tax Revenues
(Per Cent)
|
|
2004-05
|
2005-06
|
2006-07
|
2007-08
|
2008-09
|
2009-10
|
2010-11
|
2011-12
|
2012-13 (RE)
|
2013-14 (BE)
|
|
Own Non-Tax Revenue
|
100
|
100
|
100
|
100
|
100
|
100
|
100
|
100
|
100
|
100
|
|
Interest Receipts
|
7.2
|
5.5
|
3.1
|
7.1
|
8.9
|
9.9
|
7.2
|
12.0
|
7.2
|
9.1
|
|
Dividends and Profits
|
0.8
|
1.0
|
0.4
|
0.3
|
0.4
|
0.1
|
0.8
|
0.0
|
0.1
|
0.3
|
|
Police
|
3.9
|
12.4
|
8.1
|
6.9
|
4.0
|
3.3
|
9.9
|
5.3
|
15.2
|
15.8
|
|
Public Works
|
2.2
|
2.7
|
2.2
|
2.0
|
1.7
|
0.6
|
1.6
|
2.2
|
1.4
|
1.4
|
|
Administrative Services
|
3.4
|
2.6
|
1.5
|
1.2
|
0.9
|
1.0
|
1.4
|
2.7
|
1.3
|
1.3
|
|
Net Lottery Income
|
28.0
|
19.5
|
29.1
|
14.5
|
15.0
|
9.2
|
16.4
|
17.8
|
16.9
|
12.6
|
|
Edu, Sports, Art & Cult.
|
0.7
|
0.8
|
0.6
|
0.6
|
0.6
|
0.4
|
0.6
|
0.6
|
0.4
|
0.5
|
|
Medical and Pub. Health
|
0.9
|
0.8
|
0.3
|
0.5
|
0.3
|
0.2
|
0.2
|
0.5
|
0.4
|
0.4
|
|
Water Sup. and Sanitation
|
1.0
|
1.0
|
1.2
|
1.0
|
0.9
|
0.6
|
1.2
|
1.2
|
1.2
|
1.2
|
|
Urban Development
|
0.8
|
0.6
|
0.4
|
0.6
|
0.5
|
0.7
|
0.3
|
0.7
|
0.3
|
0.2
|
|
Forestry and Wildlife
|
7.1
|
8.8
|
5.5
|
5.2
|
3.9
|
2.0
|
4.5
|
5.1
|
4.6
|
4.8
|
|
Plantations
|
1.5
|
1.8
|
1.1
|
1.0
|
0.8
|
0.4
|
1.1
|
1.1
|
1.1
|
1.1
|
|
Other Rural Dev. Prog.
|
0.7
|
1.1
|
0.6
|
0.5
|
0.4
|
0.6
|
0.5
|
0.5
|
0.4
|
0.5
|
|
Power
|
19.2
|
24.6
|
33.9
|
46.1
|
52.9
|
64.2
|
40.9
|
32.7
|
33.9
|
34.6
|
|
Road Transport
|
19.3
|
12.0
|
8.6
|
7.4
|
6.0
|
4.6
|
9.3
|
12.7
|
10.8
|
11.3
|
|
Tourism
|
0.7
|
0.7
|
0.5
|
0.6
|
0.7
|
0.4
|
1.3
|
0.8
|
1.7
|
1.8
|
|
Others
|
2.6
|
4.1
|
2.7
|
4.6
|
1.9
|
2.0
|
2.8
|
4.2
|
3.1
|
3.2
|
Source (Basic Data): Finance Accounts and State
Budget 2013-14
Central Transfers as Percentage of GSDP
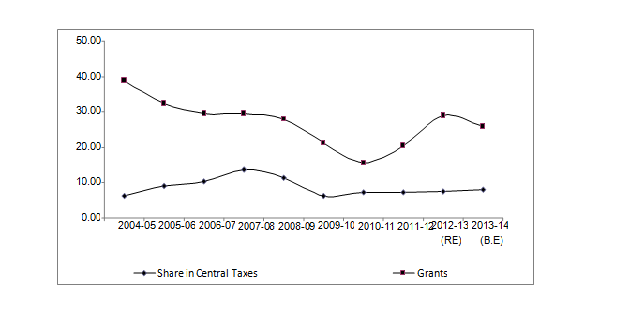
From the Figure 1 it is evident that the share
in central taxes remained at about 8 per cent of GSDP in recent
years. Comparatively the Central grants contribute more to the State
revenues. The Central grant to the State was further widened due to
the recommendations of the TFC relative to various state specific
grants and performance incentive grant. Starting from 2011-12, the
State has been receiving State specific grants recommended by the TFC
such as development of tourism, innovation of suspension foot
bridges under North Districts of Sikkim, water security and public
health engineering, police training and infrastructure, residential
facility for police, border area development, State Capacity Building
Institute, and conservation of heritage and culture. These grants, to
be continued till 2014-15, have contributed substantially to the
overall revenues of the State and facilitated building infrastructure
in the sectors for which grants are targeted. The State has
also received performance incentive grant for three years from
2010-11 to 2012-13. The State continues to get TFC grants for
elementary education, environment related grants including forest,
and water sector management, incentive grants to improve quality of
public expenditure starting from 2010-11 to 2014-15. The grants for
maintenance of roads and bridges, however, started in the year
2011-12.
3.3 Expenditure Profile
The social sector, particularly education and
health in Sikkim, receive special attention in the resource
allocation. In order to improve the quality of education and health
infrastructure, the State Government has initiated several measures.
The expenditure pattern presented in Table 6 reflects these trends
over the years. Due to spurt in growth of GSDP in 2009-10, the ratio
of expenditure variables with GSDP declined. Thus the expenditure
pattern since 2009-10 will be of interest in the context of the MTFP.
The revenue expenditure, which had declined from 29.8 per cent
relative to GSDP in 2009-10 to 28.9 per cent in 2011-12, is set to
rise in revised estimates for the year 2012-13 and budget estimates
for the year 2013-14. The revenue expenditure is projected to reach
at 31.2 per cent to the GSDP in 2013-14 (BE). The revenue expenditure
profile shows that while the general service remained flat relative
to GSDP, the expenditure on economic and social services have
increased during 2009-10 and 2013-14 (BE). The MTFP elaborates on the
expenditure restructuring in the medium term where emphasis has been
given to priority sector development spending.
Table 6
Expenditure Profile
(Per cent to GSDP)
|
|
2004-05
|
2005-06
|
2006-07
|
2007-08
|
2008-09
|
2009-10
|
2010-11
|
2011-12
|
2012-13 (RE)
|
2013-14 (BE)
|
|
Revenue Expenditure
|
48.4
|
44.7
|
45.1
|
45.8
|
42.8
|
29.8
|
28.2
|
28.9
|
30.6
|
31.2
|
|
General Services
|
14.9
|
14.4
|
15.5
|
15.5
|
13.8
|
10.7
|
9.6
|
9.0
|
10.0
|
10.4
|
|
Interest Payment
|
5.7
|
5.1
|
5.3
|
4.7
|
4.8
|
2.5
|
2.6
|
2.3
|
2.2
|
2.0
|
|
Pension
|
1.8
|
2.1
|
2.3
|
2.0
|
1.8
|
2.1
|
2.2
|
2.1
|
2.6
|
2.7
|
|
Other General Services Excluding Salary
|
7.4
|
7.2
|
7.9
|
8.8
|
7.2
|
6.2
|
4.7
|
4.6
|
5.2
|
5.7
|
|
Social Services
|
17.6
|
16.9
|
16.5
|
17.5
|
16.7
|
11.3
|
11.4
|
12.3
|
11.4
|
12.1
|
|
Education
|
8.8
|
9.4
|
9.3
|
9.1
|
8.4
|
6.4
|
7.6
|
5.6
|
5.7
|
6.0
|
|
Medical and Public Health
|
2.8
|
2.3
|
2.3
|
2.6
|
2.3
|
1.8
|
1.5
|
1.4
|
1.3
|
1.3
|
|
Other Social Services
|
6.0
|
5.2
|
4.9
|
5.8
|
6.0
|
3.1
|
2.4
|
5.3
|
4.4
|
4.9
|
|
Economic Services
|
15.9
|
13.4
|
13.1
|
12.8
|
12.2
|
7.8
|
7.0
|
7.3
|
8.7
|
8.2
|
|
Compensation and Assignment to LBs
|
0.0
|
0.0
|
0.0
|
0.0
|
0.0
|
0.0
|
0.2
|
0.4
|
0.5
|
0.5
|
|
Capital Expenditure
|
20.4
|
17.3
|
15.1
|
16.6
|
18.9
|
11.2
|
6.4
|
7.9
|
16.1
|
12.7
|
|
Capital Outlay
|
20.3
|
17.3
|
15.1
|
16.6
|
18.9
|
10.6
|
6.3
|
7.3
|
16.0
|
12.6
|
|
Net Lending
|
0.1
|
0.0
|
0.0
|
0.0
|
0.0
|
0.6
|
0.1
|
0.6
|
0.0
|
0.1
|
Source (Basic Data): Finance Accounts and State
Budget 2013-14
The capital expenditure, which had slowed down in
2010-11 and 2011-12 relative to the GSDP, seems to have revived in
2012-13 (RE) and 2013-14 (BE). The requirements for achieving
sustainable level of debt and deficit as stipulated in the FRBM
fiscal targets required limiting the level of capital expenditure.
The capital expenditure, however, has increased from 7.9 per cent to
GSDP in 2011-12 to 16.1 per cent in 2012-13 (RE) and the budget
estimates for 2013-14 sets a target of 12.7 per cent (Table 6). The
composition of capital expenditure shows that sectors like water
supply and sanitation, transport, energy and tourism have been the
focus areas. The education and rural development sectors also have
attracted relatively higher capital expenditure. The improvement in
fiscal situation in the State provides opportunity to reinforce the
core development strategy of building the social and physical
infrastructure. The MTFP is prepared based on the rationale of
restructuring the government spending by emphasizing the critical
areas.
Table 7
Composition of Capital Expenditure
(Per Cent)
|
|
2004-05
|
2005-06
|
2006-07
|
2007-08
|
2008-09
|
2009-10
|
2010-11
|
2011-12
|
2012-13 (RE)
|
2013-14 (BE)
|
|
Capital Expenditure
|
100
|
100
|
100
|
100
|
100
|
100
|
100
|
100
|
100
|
100
|
|
General Services
|
4.7
|
5.0
|
6.5
|
9.5
|
12.6
|
13.7
|
12.6
|
4.1
|
12.6
|
15.5
|
|
Social Services
|
37.2
|
31.5
|
36.6
|
32.6
|
31.1
|
34.0
|
36.8
|
45.0
|
40.1
|
36.2
|
|
Education
|
8.3
|
7.2
|
7.7
|
4.7
|
4.8
|
4.2
|
8.7
|
10.2
|
5.9
|
5.7
|
|
Health
|
1.0
|
2.3
|
0.6
|
0.6
|
1.1
|
0.5
|
7.1
|
15.8
|
7.3
|
8.2
|
|
Water supply, Sanitation, Housing & Urban
Development
|
27.4
|
22.0
|
27.2
|
25.6
|
24.7
|
27.9
|
20.5
|
18.5
|
26.4
|
21.1
|
|
Information, Publicity & Broadcasting (21)
|
0.0
|
0.0
|
0.0
|
0.0
|
0.0
|
0.2
|
0.2
|
0.2
|
0.1
|
0.0
|
|
Welfare of SC/STBC
|
0.3
|
0.0
|
0.9
|
0.3
|
0.5
|
0.2
|
0.1
|
0.2
|
0.5
|
0.4
|
|
Social Security
|
0.2
|
0.0
|
0.1
|
1.3
|
0.1
|
0.9
|
0.1
|
0.0
|
0.0
|
0.7
|
|
Economic Services
|
58.1
|
63.5
|
57.0
|
58.0
|
56.2
|
52.3
|
50.7
|
50.9
|
47.2
|
48.3
|
|
Agriculture
|
1.1
|
1.5
|
1.8
|
1.7
|
1.5
|
2.3
|
1.4
|
2.8
|
1.8
|
1.4
|
|
Rural Development
|
3.3
|
1.9
|
7.7
|
9.2
|
4.0
|
5.2
|
5.0
|
5.8
|
1.6
|
2.1
|
|
Special Areas Programmes
|
0.9
|
7.2
|
8.0
|
5.5
|
1.7
|
1.8
|
2.5
|
2.9
|
1.8
|
1.4
|
|
Irrigation
|
0.7
|
0.6
|
0.8
|
0.7
|
0.8
|
0.5
|
1.2
|
0.5
|
0.7
|
0.4
|
|
Energy
|
28.2
|
25.5
|
11.7
|
11.4
|
10.1
|
11.1
|
7.3
|
6.1
|
7.0
|
3.5
|
|
Industries and Minerals
|
1.9
|
2.3
|
1.1
|
0.6
|
1.1
|
0.8
|
0.4
|
0.3
|
0.4
|
0.4
|
|
Transport
|
20.3
|
20.7
|
19.1
|
20.4
|
29.1
|
22.8
|
21.8
|
23.1
|
23.5
|
26.8
|
|
Science & Technology
|
0.0
|
0.0
|
0.1
|
0.4
|
0.3
|
0.2
|
0.0
|
0.0
|
0.0
|
0.0
|
|
Tourism
|
1.7
|
3.9
|
6.7
|
8.0
|
7.6
|
7.6
|
11.0
|
9.3
|
10.5
|
12.3
|
Source (Basic Data): Finance Accounts and State
Budget 2012-13
3.4 Outstanding Debt and Government Guarantee
Outstanding debt of the Government of Sikkim
has declined from 37.4 per cent in 2009-10 to 30.4 per cent in
2011-12, the last year for which audited data is available (Table 2).
The outstanding debt is estimated to fall further in RE 2012-13 and
BE 2013-14. The FRBM Act of the state stipulates to maintain the
outstanding debt at prudent and sustainable level. With the
improvement in fiscal situation in the State, the debt burden has
been slowing down. The TFC in their revised fiscal roadmap have
worked out the yearly outstanding debt burden for all the states
aligning with the fiscal path. The outstanding debt burden of Sikkim
for the years 2013-14 and 2014-15 as per the TFC fiscal roadmap is
58.80 and 55.90 relative to the GSDP respectively. The debt-GSDP
ratio in the State remains lower than that of the TFC numbers. The
decline in the average cost of debt of the state as a result of the
debt restructuring formula of the Twelfth Finance Commission has
helped to lowering the debt burden. Decline in the average cost of
debt will result in higher fiscal space for the state government
through reduction in the volume of interest payments, which has
declined from 2.5 per cent in 2009-10 relative to GSDP to 2 per cent
in 2013-14 (BE).
Table 8
Composition of Debt and Liabilities
(Per Cent)
|
|
2008-09
|
2009-10
|
2010-11
|
2011-12
|
2012-13 (RE)
|
|
A. Public Debt
|
76.87
|
78.15
|
74.63
|
72.56
|
72.47
|
|
Internal Debt
|
61.34
|
65.86
|
63.94
|
66.41
|
66.71
|
|
Loans and Adv. from the Central Govt.
|
15.53
|
12.28
|
10.69
|
6.15
|
5.76
|
|
B. Other Liabilities
|
23.13
|
21.85
|
25.37
|
27.44
|
27.53
|
|
Small Savings, Provident Fund etc
|
18.94
|
17.96
|
21.00
|
22.67
|
23.82
|
|
Reserve Fund
|
1.32
|
1.04
|
0.85
|
0.72
|
0.02
|
|
Deposits
|
2.87
|
2.85
|
3.51
|
4.05
|
3.70
|
|
Total Public Debt & Other Liabilities
|
100
|
100
|
100
|
100
|
100.00
|
Source (Basic Data): Finance Accounts and State
Budget 2013-14
The accumulated stock of debt is the outcome of the
fiscal profile that has emerged over the years. The structure
of outstanding debt has an important bearing on interest payment as
different debt instruments carry different rates of interest
depending on the type of borrowing and maturity structure. The share
of market borrowing in the state has increased over the years while
the share of loans and advances from the Central government has
declined in the last two years (Table 8). The share of high cost debt
instruments like small savings, provident funds, etc. has shown a
rising trend since 2008-09.
The Planning Commission of India has indicated
six parameters to determine the quality of debt stock of any State.
1.
The Debt Stock should be below 30 per cent
of the GSDP.
2.
Debt should be below 300 per cent of the
Total Revenue Receipts (TRR).
3.
The interest payment should be less than 18
per cent as a ratio of TRR.
4.
The debt growth should not be more than
1.25 times the growth in revenues.
5.
The revenue component of the fiscal deficit
should not be more than 50 per cent.
6.
The fiscal deficit should not be more than
25 per cent of the TRR.
The degree of debt overhang for Sikkim as
examined taking into consideration these criteria is given in Table
9. The debt ratio remained above 30 per cent of GSDP till
2011-12 and has come down after that. The debt as a percentage of TRR
remained much below 300 per cent and declining sharply in recent
years and was as low as 68.8 per cent in 2012-13 (RE). The interest
payment as a percentage of TRR remained below 18 per cent as
indicated in the Planning Commission parameters. The state government
could generate a revenue surplus and the ratio of debt growth to
revenue growth is below the permissible target of 1.25. The
state’s fiscal deficit remained below 25 per cent of the TRR.
Table 9
Indicators of Debt Management
(Per Cent)
|
|
2009-10
|
2010-11
|
2011-12
|
2012-13 (RE)
|
|
Debt Stock as per cent of GSDP*
|
37.4
|
34.0
|
30.4
|
29.9
|
|
Debt as a per cent of TRR
|
97.8
|
112.9
|
88.9
|
68.8
|
|
Interest payment as a per cent of TRR
|
6.6
|
8.7
|
6.6
|
5.0
|
|
Growth rate of debt
|
18.6
|
6.0
|
5.1
|
9.5
|
|
Growth rate of revenue
|
33.4
|
-8.3
|
33.5
|
41.5
|
|
Ratio debt growth-revenue growth
|
0.6
|
-0.7
|
0.2
|
0.2
|
|
FD as a per cent of TRR
|
7.2
|
14.7
|
6.3
|
7.4
|
Note: This represents the aggregate debt liabilities
of the State
Guarantees given by the State Government
As per the Sikkim Government Guarantee Act, 2000,
the ceiling on total outstanding government guarantee in a year is
restricted to three times of the State’s tax revenue receipts
of the second preceding year. The outstanding sum guaranteed by the
State government on 31st
March 2013 was Rs.310. crore (Budget Documents – 2013-14),
which is below the permissible limit.
4. Medium Term Fiscal Plan: 2013-14 to 2015-16
4.1 Fiscal Indicators
Table 10 (follows
Form F2 of the Act)
Fiscal Indicators-Rolling Targets
|
|
|
Previous Year (Y-2) Actuals
|
Current Year (Y-1) Revised Estimates
|
Ensuing Year (Y)
Budget Estimates
|
Targets for Year (Y+1
|
Targets for Year Y+2)
|
|
|
|
2011-12
|
2012-13 (RE)
|
2013-14 (BE)
|
2014-15
|
2015-16
|
|
1
|
Revenue deficit as percentage of GSDP
|
-5.27
|
-12.85
|
-9.74
|
-10.50
|
-11.34
|
|
2
|
Revenue deficit as percentage of Total Revenue
Receipts (TRR)
|
-15.41
|
-29.55
|
-23.77
|
-24.13
|
-24.53
|
|
3
|
Fiscal deficit as percentage to GSDP
|
2.14
|
3.24
|
3.00
|
3.00
|
3.00
|
|
4
|
Total Outstanding Liabilities as percentage of
GSDP
|
30.39
|
29.92
|
29.90
|
29.87
|
29.85
|
Notes:
GSDP is the Gross Domestic Product at
current prices as per revised series of 2004-05 base
The negative sign in revenue deficit indicates
surplus.
The fiscal indicators such as fiscal deficit,
revenue deficit and liabilities showing the fiscal outcomes for
previous year, current year, ensuing budget year and two outward
years are presented in the Form F-1 following the stipulations of the
Sikkim FRBM Act (Table 10). The fiscal indicators show that there has
been an improvement in fiscal situation and the State Government
achieved the targets of the fiscal path chalked out by the Thirteenth
Finance Commission (TFC) starting from the year 2012-13. After the
enactment of the FRBM Act of Sikkim in 2010, this is the third MTFP
document that contains fiscal projections for the period 2013-14 (BE)
to 2015-16. The MTFP builds on the fiscal consolidation process of
the State Government and the fiscal outlook for the budget year and
the two outward years comply with the TFC fiscal path. It needs to be
mentioned here that the fiscal path chalked out by the TFC ends at
2014-15, whereas the MTFP goes beyond this target year. However the
MTFP assumes that the fiscal management in the State will continue to
be prudent and remain sustainable even after the TFC targets. The
Fourteenth Finance Commission, which has already been constituted,
will provide guidelines and principles for fiscal management for the
State Government starting from the year 2015-16. The Government
of Sikkim is committed to adhere to the fiscal path to be suggested
by the Fourteenth Finance Commission also.
Table 11
Medium Term Fiscal Plan: 2012-13 to 2014-15
(AS Percent to GSDP)
|
|
2011-12
|
2012-13
|
2013-14
|
2014-15
|
2015-16
|
|
Revenue Receipts
|
34.19
|
43.49
|
40.98
|
43.52
|
46.25
|
|
Own Tax Revenues
|
3.50
|
3.96
|
4.09
|
4.14
|
4.19
|
|
Income Tax
|
0.00
|
0.00
|
0.00
|
0.00
|
0.00
|
|
Sales Tax
|
1.48
|
2.18
|
2.16
|
2.21
|
2.25
|
|
State Excise Duties
|
1.15
|
1.02
|
1.05
|
1.02
|
1.00
|
|
Motor Vehicle Tax
|
0.20
|
0.16
|
0.16
|
0.16
|
0.16
|
|
Stamp Duty and Registration Fees
|
0.10
|
0.08
|
0.08
|
0.07
|
0.07
|
|
Other Taxes
|
0.58
|
0.52
|
0.64
|
0.68
|
0.71
|
|
Own Non-Tax Revenues
|
2.91
|
3.16
|
3.06
|
3.08
|
3.11
|
|
Central Transfers
|
27.79
|
36.37
|
33.82
|
36.29
|
38.95
|
|
Tax Share
|
7.28
|
7.47
|
8.00
|
8.63
|
9.31
|
|
Grants
|
20.51
|
28.90
|
25.82
|
27.66
|
29.64
|
|
Revenue Expenditure
|
28.92
|
30.64
|
31.24
|
33.02
|
34.90
|
|
General Services
|
8.96
|
9.96
|
10.40
|
11.02
|
11.69
|
|
Interest Payment
|
2.27
|
2.15
|
1.99
|
2.11
|
2.11
|
|
Pension
|
2.07
|
2.56
|
2.73
|
3.18
|
3.70
|
|
Other General Services
|
4.62
|
5.24
|
5.68
|
5.74
|
5.88
|
|
Social Services
|
12.28
|
11.43
|
12.15
|
12.96
|
13.82
|
|
Education
|
5.65
|
5.70
|
5.96
|
6.31
|
6.69
|
|
Medical and Public Health
|
1.36
|
1.35
|
1.30
|
1.34
|
1.39
|
|
Other Social Services
|
5.28
|
4.38
|
4.89
|
5.31
|
5.75
|
|
Economic Services
|
7.31
|
8.72
|
8.16
|
8.51
|
8.87
|
|
Compensation and Assignment to LBs
|
0.37
|
0.53
|
0.53
|
0.53
|
0.53
|
|
Capital Expenditure
|
7.92
|
16.09
|
12.74
|
13.50
|
14.34
|
|
Capital Outlay
|
7.33
|
16.04
|
12.65
|
13.42
|
14.27
|
|
Net Lending
|
0.59
|
0.05
|
0.09
|
0.08
|
0.07
|
|
Revenue Deficit
|
-5.27
|
-12.85
|
-9.74
|
-10.50
|
-11.34
|
|
Fiscal Deficit
|
2.14
|
3.24
|
3.00
|
3.00
|
3.00
|
|
Primary Deficit
|
-0.13
|
1.08
|
1.01
|
0.89
|
0.89
|
|
Outstanding Debt
|
30.39
|
29.92
|
29.90
|
29.87
|
29.85
|
Notes: 1.
GSDP is the Gross Domestic Product at
current prices as per revised series of 2004-05 base
2.
The negative sign in revenue deficit
indicates surplus.
The detailed projection of fiscal variables
presented in Table 11 shows that the revenue account surplus has been
growing during the MTFP period and the fiscal deficit has been
stabilized at 3 per cent relative to the GSDP. Starting with
the budget year, the capital expenditure has grown in the last two
years of the MTFP. The capital expenditure could be raised due to
significant revenue surplus without adversely affecting the fiscal
deficit. Investments in physical and social infrastructure have
received larger attention in the State for which capital expenditure
has grown steadily. The focus on investments in infrastructure will
remain a key factor in fiscal policy of the Government with the State
economy growing in future years. Higher growth of the economy which
would further improve the revenue situation coupled with prudent
expenditure management is expected to improve the capital
expenditure.
4.2 Assumption Underlying the Fiscal
Indicators
According to the TFC roadmap for fiscal
consolidation, Sikkim was expected to achieve 3.5 per cent fiscal
deficit relative to GSDP by 2011-12 and reach at 3 per cent level by
2013-14. Despite the natural calamities and disruption in
business activities affecting revenues the State managed to adhere to
the TFC fiscal targets as stipulated in the FRBM Act of Sikkim. The
MTFP assumes to continue with the fiscal consolidation process and
structure the expenditures in the priority areas to help the
development process in the State.
The MTFP uses the GSDP growth rate prescribed
by the TFC on a year on year basis for the period from 2013-14 to
2014-15 for Sikkim (see Box 1). For the year 2015-16, which is beyond
the TFC award period, the MTFP uses the same growth rate as that of
the year 2014-15. For the purpose of MTFP, instead of taking
aggregate own revenue, prescriptive buoyancy based growth rates of
individual taxes are used for projection purpose. The buoyancy
coefficients for the period 2004-05 to 2013-14 indicate that the
growth rate of the State taxes is below the growth rate of the GSDP.
The prescriptive buoyancies for individual taxes like sales tax,
excise duty, motor vehicle tax, stamps and registration duties have
been increased keeping in mind the scope for improvement in these
taxes. For other taxes, the observed buoyancy for the period between
2004-05 and 2013-14 was taken as prescriptive buoyancies. The 2013-14
budget projected higher sales tax collection target of Rs.225 crores
as against actual figures of Rs.124.19 croers in 2011-12.. The higher
tax collection target was based on the Government’s attempt to
streamline the tax administration and expansion of tax base. The
Government has initiated major e-governance programmes in the tax
departments to introduce online registration, e-filling of returns
and electronic control and evaluation majors.
The MTFP proposes to keep the trend growth rate
of non-tax revenues for the period from 2004-05 to 2013-14 (BE) for
the purpose of projection. In the case of central transfers also, the
recommended State specific grants by the TFC are factored in during
the projection year. For the share in central taxes budgetary figure
for the year 2013-14 is allowed to grow at a rate marginally lower
than the observed rate of trend growth rate during 2004-05 to 2013-14
(BE).
Expenditure Restructuring under MTFP
The revenue expenditure has been stabilized at
around 30 per cent relative to GSDP since 2009-10. The profile of
expenditure in the State reveals that due to higher emphasis on
priority sector spending the revenue expenditure as percentage to
GSDP has increased in RE 2012-13 and BE 2013-14. The MTFP proposes to
continue with this fiscal management approach and provide higher
level of sources to priority sectors. The MTFP, while restructuring
the expenditure, keeps in consideration the fiscal targets to be
achieved by the State in the medium term. Thus
attempt was not made to compress the revenue expenditure to achieve
the fiscal targets. In the medium term efforts have been made to
improve the revenue surplus through higher revenue generation and
provide for the spending in the development sector. The encouraging
trend that comes out of the expenditure structure is the rise in
share of social and economic services in resource allocation.
The ensuing budget contains policy
announcements regarding new schemes in various sectors. The
Government initiated several new schemes to improve social and
economic infrastructure last year. The resource allocation in the
MTFP has taken into consideration all the existing programmes and new
schemes proposed in the 2013-14 budget announcements. The existing
and new schemes in various sectors like agriculture and rural
development, health, education, tourism, and other infrastructure
sectors underline the focus areas for the Government in the medium
term. Based upon the announced policies of the State Government, the
MTFP proposes to strengthen social and economic sector expenditure
further by making adequate provisions. The social sector expenditure
as per cent of GSDP increases from 12.15 per cent in BE 2013-15 to
13.82 per cent in 2015-16. Similarly the expenditure under economic
services has increased from 8.16 to 8.87 per cent during this period.
The general services also experience a rise.
The revenue expenditure, taking into account
allocations to different sectors based on Government priorities
during the MTFP period, rises from 31.24 per cent to GSDP in BE
2013-14 to 34.90 per cent in 2015-16 (Table 11). The rise in revenue
expenditure during the projection period is not very sharp and the
MTFP takes a balanced view between keeping the focus on social and
economic sectors intact and remain in the fiscal consolidation. The
rise in revenue expenditure does not reduce the revenue surplus,
which is used for higher capital expenditure and stabilize the fiscal
deficit..
The capital expenditure at 12.74 per cent to
GSDP in 2013-14 (BE) has been higher than that for the year 2011-12
at 7.92 per cent. As the fiscal deficit is stabilized at 3 per cent
to GSDP and revenue account surplus has been growing in the medium
term, the capital expenditure is allowed to grow during the MTFP
period. The capital expenditure increased from 12.74 per cent to GSDP
in 2013-14 (BE) to 14.34 per cent in 2015-16. The capital expenditure
is raised during the MTFP period aligned with the fiscal targets. The
MTFP keeps the requirements of infrastructural development in the
State and immediate need for rebuilding of the earthquake affected
infrastructure while projecting the capital expenditure.
Debt and Deficit under MTFP
The revenue surplus profile, which indicates a
rising trend during the MTFP period, is given in Table 11. The rise
in revenues that includes central transfers and controlled increase
in revenue expenditure resulted in higher revenue surplus. The fiscal
deficit has been estimated to remain at 3 per cent level starting
with the 2013-14 (BE). The fiscal deficit target complies with the
fiscal adjustment prescribed by the TFC for Sikkim. The emerged
fiscal profile shows that the outstanding debt is also stabilized
below 30 per cent relative to GSDP.. This debt-GSDP ratio path
remains lower than that of the debt path for Sikkim proposed by the
TFC. The TFC has assumed a debt-GSDP ratio of 58.80 per cent in
2013-14, and 55.90 per cent in 2014-15 (see Report of TFC,
Annex 9.1, pp 409). It needs to be emphasized here that the State
Government is committed to strengthen the fiscal consolidation
process and achieve the objectives of the FRBM Act.
Box 1
Proposed MTFP Targets
|
Macro Parameters
·
Nominal Growth of GSDP as prescribed by
the TFC, 11.25 per cent
Revenue Resources
·
Sales tax assumes a buoyancy of 1.2 as
against the observed buoyancy of 0.687
·
The state excise duty assumes a buoyancy
of 0.750.
·
The stamp duty and registration fees
assumes a buoyancy of 0.800
·
Motor Vehicle tax assumes a buoyancy of
1.00
·
Other taxes assumes a buoyancy of 1.501
Expenditure Projections
·
Pension payments are projected on the
basis of the historical growth rates for pension payments for the
period from 2004-05 to 2013-14 (BE). The observed growth of
pension during this period was 30 per cent.
·
The interest payments have been
estimated on the basis of the effective rate of interest
calculated on the base year (2011-12) value of interest payment
divided by the stock of debt of the previous year.
·
The growth rates in the area of high
priority development expenditure in social services and within
that, in health and education, are assumed to continue during the
MTFP period.
·
Social services expenditures will grow
at the rate of 18.66 per cent per annum.
·
Education expenditure will grow at the
rate of 17.86 per cent per annum
·
Health expenditure will grow at the rate
of 15.00 per cent per annum.
·
Capital expenditure to GSDP ratio is
expected to increase from 12.74 per cent in 2013-14 (BE) to 14.34
per cent in 2015-16 with a growth rate of 17 per cent.
Deficit and Debt targets
·
The MTFP 2013-14 to 2015-16 projects the
revenue surplus to increase from 9.74 per cent to the GSDP to
11.34 per cent.
·
The fiscal deficit is projected to
remain at 3 per cent level relative to the GSDP
·
The outstanding debt to GSDP ratio is
expected to decline from 29.90 per cent to 29.85 per cent.
|
5. Conclusion
The MTFP covering the period from 2013-14 (BE) to 2015-16 has been
prepared on a backdrop of an improved fiscal situation in the State.
The fiscal performance indicators for the year 2011-12, the last year
for which the actual data is available, reflect this situation. The
State Government has initiated several schemes in the social and
economic sectors in recent years. The MTFP has been prepared with
objective of safeguarding the fiscal consolidation process and
provide adequate resources to existing schemes in priority areas.
Thus the medium term framework is based on detailed analysis of the
state finances and the revenue and expenditure policies announced in
recent years and in the budget of 2013-14. The revenue augmentation
measures, expenditure side restructuring based on the priorities
expressed in the budget, and the resultant borrowing requirements are
elaborated in the MTFP. In the revenue side, the need for improving
revenue receipts is reflected in the changes in tax policies and tax
administration measures. The MTFP makes projections for two outward
years beyond the BE 2013-14 keeping the requirement of achieving
fiscal prudence to continue on the proposed fiscal roadmap of the
TFC. The MTFP proposes to maintain the 3 per cent fiscal deficit
relative to GSDP and generate increasing level of surplus in the
revenue account. The favourable fiscal situation made it possible to
increase the capital expenditure during the MTFP period. As the
growth prospective for the state looks bright in the coming years,
the State will be able to increase the capital expenditure. The debt
burden of the State is already below the limits suggested by the TFC.
With the decline in debt servicing obligation for the state based on
realistic assumption with regard to the average cost of debt and the
level of fiscal deficit, the debt burden is further projected to
decline. To conclude, the Government of Sikkim is committed to
maintain the fiscal discipline and stability in the State and manage
the fiscal policy to strengthen the growth process.
Disclosures
Form D-1
(See Rule 4)
Select Fiscal Indicators
|
Sl. No.
|
Item
|
Previous Year
2011-12 (Actuals)
|
Current Year
2012-13(RE)
|
|
1
|
Gross Fiscal Deficit as Percentage to GSDP
|
2.14
|
3.24
|
|
2
|
Revenue Deficit as Percentage of GSDP
|
-5.27
|
-12.85
|
|
3
|
Revenue Deficit as Percentage of Gross Fiscal
Deficit
|
-245.61
|
-396.83
|
|
4
|
Revenue deficit as Percentage of TRR
|
-15.41
|
-29.55
|
|
5
|
Debt Stock as Percentage of GSDP
|
28.94
|
28.81
|
|
6
|
Total Liabilities as Percentage to GSDP
|
30.39
|
29.92
|
|
7
|
Capital Outlay as Percentage of Gross Fiscal
Deficit
|
341.78
|
495.31
|
|
8
|
Interest Payment as Percentage of TRR
|
6.64
|
4.95
|
|
9
|
Salary Expenditure as Percentage of TRR
|
37.29
|
29.00
|
|
10
|
Pension Exp. As Percentage of TRR
|
6.05
|
5.90
|
|
11
|
Non-development Expenditure as Percentage of
Aggregate Disbursements
|
25.54
|
25.67
|
|
12
|
Non-tax Revenue as Percentage of TRR
|
8.50
|
7.26
|
Form D-2
(See Rule 4)
Components of State Government Liabilities
Rs. Crore
|
Category
|
Raised during the fiscal year
|
Repayment during the fiscal year
|
Outstanding Amount
(End March)
|
|
Previous Year (Actuals)
|
Current year
(RE)
|
Previous Year (Actuals)
|
Current year
(RE)
|
Previous Year (Actuals)
|
Current year
(RE)
|
|
Internal Debt
|
86.89
|
232.26
|
45.30
|
62.30
|
1695.26
|
1865.22
|
|
Loan from Centre
|
0.55
|
14.50
|
3.36
|
10.45
|
157.00
|
161.05
|
|
State Provident Funds
|
195.35
|
209.50
|
126.83
|
122.35
|
578.80
|
665.95
|
|
Reserve Funds/Deposits
|
410.45
|
127.33
|
394.77
|
145.11
|
121.76
|
103.98
|
|
Other Liabilities
|
|
|
|
|
|
|
Form D-3
(See Rule 4)
Guarantees Given by the Government (Rs. Crore)
|
Sl.No
|
Name of the Institution to which Guarantees is
given
|
Maximum Guarantee given
|
Remarks.
|
|
1
|
Sikkim Industrial Development &
Investment Corporation Ltd.
|
285.00
|
|
|
2
|
Scheduled Castes Scheduled Tribes and Other
Backward Classes Development Corporation Ltd. (SABCO)
|
25.00
|
|
|
|
Total
|
310.00
|
|
|
|
|
|
|
Form D-4
(See Rule 4)
Number of Employees in Public Sector Undertakings &
Aided Institutions and Expenditure of State Government
|
Sl.No
|
Sector Name
|
Total Employees as on 31.3.2013
|
Related Expenditure
Rs. Crore
|
|
|
|
|
On Salary
|
On Pension
|
|
A( a)
|
Regular government Employees
|
30903
|
1178.91
|
239.66
|
|
( b)
|
Work Charged
|
1636
|
|
|
|
( c)
|
Muster Roll
|
10801
|
|
|
|
(d)
|
Others
|
10739
|
|
|
|
|
|
|
|
|
|
B
|
Public Sector Undertakings & Aided
Institutions
|
|
|
|
|
1
|
State Bank of Sikkim
|
314
|
11.05
|
|
|
2
|
Govt. Fruit Preservation Factory
|
87
|
1.02
|
|
|
3
|
Sikkim Hatcheries Pvt. Ltd
|
10
|
0.06
|
|
|
4
|
Sikkim Poultry Dev corp.
|
5
|
0.04
|
|
|
5
|
Sikkim Handloom
and Handicraft Dev. Corp.
|
9
|
0.41
|
|
|
6
|
Denzong Agricultural Co operative Society.
|
40
|
0.47
|
0.009
|
|
7
|
Sikkim State Co- Operative Bank Ltd.
|
60
|
2.11
|
0.22
|
|
8
|
Sikkim Co- Operative Milk Producers' Ltd.
|
133
|
1.73
|
0.10
|
|
9
|
Sikkim Schedule Caste & Schedule Tribe
and Other Backward Classes Dev. Co operation Ltd. (SABCO)
|
23
|
0.95
|
|
|
10
|
State Trading Corporation of Sikkim.
|
63
|
2.42
|
0.12
|
|
11
|
Sikkim Industrial
Dev and Investment Corporation Ltd.
|
43
|
1.81
|
|
|
12
|
Sikkim Tourism Dev. Corporation Ltd.
|
87
|
1.10
|
0.05
|
|
13
|
Sikkim State Co-Operative Supply &
Marketing Federation Ltd.
|
88
|
2.42
|
0.026
|
|
14
|
Sikkim Power Dev.
Corporation .
|
66
|
0.92
|
|
|
15
|
Sikkim Consumers' Co operative Society Ltd.
|
26
|
0..37
|
|
|
16
|
Sikkim Livestock
Processing & Development Corporation Ltd
|
2
|
0.03
|
|
Source of information of Sl.A is from DESM&E.The
total employee under A(d) is inclusive of B.